

A visitor finds your service page on Google. The headline appears, but the hero image takes several seconds to load. They tap the enquiry button, and nothing happens. They tap again, and the form jumps down the page just as they start typing. Most people will not wait to see whether it gets better.
Problems like these rarely appear on a fast laptop and office Wi-Fi, yet real visitors hit them every day. A Core Web Vitals Audit is a systematic way to find them. Instead of guessing why a page feels slow, you review real-user data, trace each problem to its technical cause, and fix the issues that matter most to your business first.
This guide explains what an audit involves, the three metrics to check in 2026, a five-step process using free Google tools, and how performance connects to technical SEO and lead generation.
What Is a Core Web Vitals Audit?
A Core Web Vitals Audit is a structured review of how real visitors experience your pages, followed by diagnosis and a prioritised list of fixes. A basic speed test gives you a score for one page, measured once, from one location. An audit asks broader questions: which pages and templates are affected, on which devices, why, and what should be fixed first.
A thorough website performance audit usually includes:
- Reviewing real-user performance data from the Chrome User Experience Report, surfaced through Google Search Console and PageSpeed Insights.
- Identifying affected pages and page templates, such as every blog post or every service page built on the same layout.
- Diagnosing technical causes with laboratory tools.
- Prioritising improvements by impact, effort, and business value.
- Fitting the findings into a broader technical SEO strategy, alongside crawlability, indexing, and site structure.
Think of a restaurant. A speed test times one meal on a quiet Tuesday. An audit studies a month of orders, finds that Friday dinners are slow, and traces the delay to the kitchen, not the dining room.
The Three Core Web Vitals You Need to Check in 2026
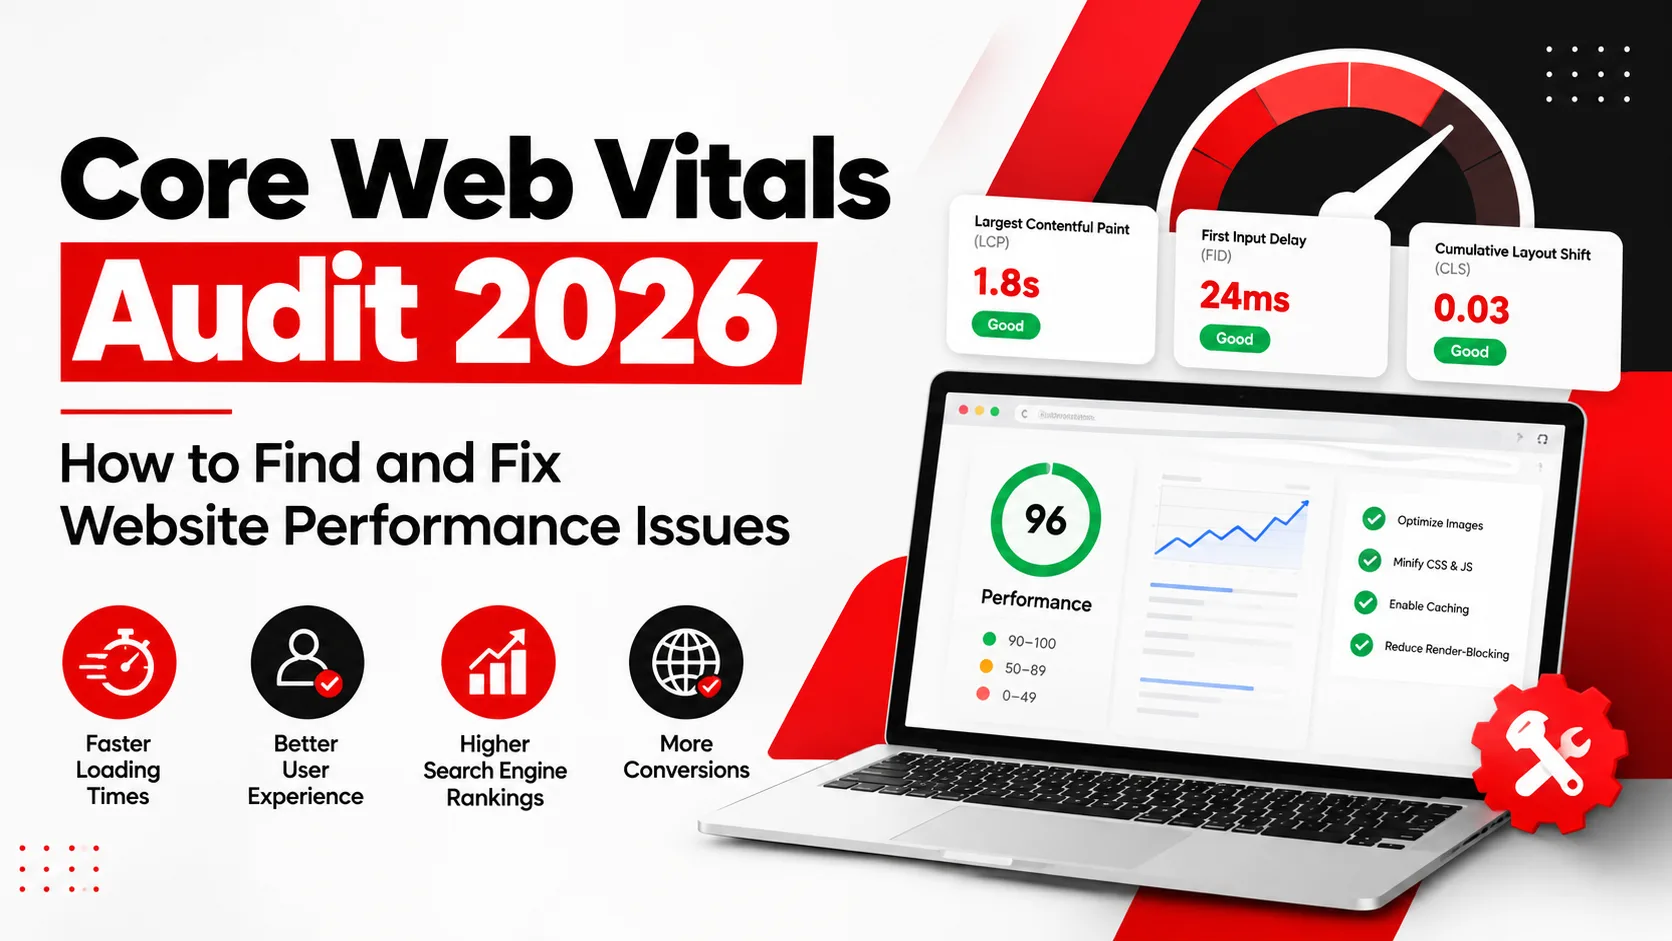
Core Web Vitals are three metrics that describe loading, responsiveness, and visual stability. Google's documentation assesses each one at the 75th percentile of real visits, so a page needs a good result for most of its visitors, not just the fastest ones. The thresholds below are the same for mobile and desktop.
Largest Contentful Paint (LCP)
- What it measures: how quickly the largest visible element, usually a hero image or main heading, finishes loading.
- Good threshold: 2.5 seconds or less. Above 4 seconds is rated poor.
- Common causes: slow server responses, oversized images, and CSS or JavaScript files that block the page from rendering.
- Example: a service page uses a 3 MB hero photo straight from a camera, so mobile visitors stare at blank space for several seconds.
- Typical fixes: compress and resize images, serve modern formats such as WebP or AVIF, avoid lazy-loading the hero image, use caching or a content delivery network, and defer scripts that are not needed for the first view.
Interaction to Next Paint (INP)
- What it measures: how quickly the page responds visually after taps, clicks, and key presses. INP replaced First Input Delay as a Core Web Vital in March 2024 and looks at interactions across the whole visit, not just the first one.
- Good threshold: 200 milliseconds or less. Above 500 milliseconds is rated poor.
- Common causes: long JavaScript tasks that keep the browser busy, inefficient event handlers, and heavy third-party scripts.
- Example: a visitor opens the mobile menu or submits a form, and the page freezes for half a second while scripts run.
- Typical fixes: break long tasks into smaller pieces, remove unused JavaScript, keep event handlers lightweight, and postpone non-essential work until after the interaction.
Cumulative Layout Shift (CLS)
- What it measures: how much visible content moves unexpectedly while the page loads and is used. It is a unitless score rather than a time.
- Good threshold: 0.1 or less. Above 0.25 is rated poor.
- Common causes: images without set dimensions, banners or embeds injected above existing content, and web fonts that swap in and resize the text.
- Example: a visitor is reading a paragraph when a cookie banner loads above it and pushes the text down, or they tap "Submit" and hit a different button because the layout moved.
- Typical fixes: add width and height attributes to images and video, reserve space for dynamic content, and configure font loading so text does not jump.
- In short: LCP asks how fast the main content appears, INP asks how fast the page reacts, and CLS asks whether the page stays still.
How to Perform a Core Web Vitals Audit Step by Step
Step 1: Review Google Search Console
Open the Core Web Vitals report in Google Search Console. It groups URLs by status (Poor, Needs improvement, Good), by metric, and by URL group, which means sets of similar pages. A group takes the status of its weakest metric, so one poor result is enough to flag it.
Start with the Poor groups, then Need improvement. Compare mobile and desktop separately, because a site can pass on desktop and struggle on phones. Note the metric, device, and number of URLs affected. Only indexed URLs with enough data appear, so low-traffic pages may be missing.
Step 2: Test Important Pages With PageSpeed Insights
Pick representative pages: the homepage, your highest-value service pages, a typical blog post, and any paid or organic landing page. Run each through PageSpeed Insights.
Each report has two parts. Field data comes from real Chrome users and shows what visitors actually experienced. Lab data comes from a simulated test run in Lighthouse under fixed conditions. Field data tells you whether a problem exists. Lab data helps you work out why. If a page lacks enough traffic, the tool may show site-wide data instead, so read the labels carefully.
Step 3: Identify the Root Causes
Use the diagnostics in the lab report and your browser's developer tools to look for:
- Server response time: slow hosting, uncached pages, or heavy database queries.
- Image optimisation: oversized files, wrong formats, or missing responsive sizes.
- JavaScript execution: large bundles and long tasks that delay interaction.
- Render-blocking resources: CSS and scripts that must load before anything appears.
- Third-party scripts: chat widgets, tag managers, heatmaps, and ad tools.
- Fonts and layout instability: large font files, font swapping, and elements with no reserved space.
Step 4: Prioritise High-Impact Problems
Rank problems using four questions:
- How severe is it? A Poor rating matters more than a borderline one.
- How many pages share the cause? One template fix can improve hundreds of URLs.
- How important is the page to the business? A pricing or enquiry page outranks an old archive post.
- Where does it interrupt the visitor journey? A slow hero is annoying, but a form that will not respond costs enquiries.
Step 5: Implement Fixes and Validate Results
After changes go live, retest the pages in PageSpeed Insights and confirm that the lab results improved. Then monitor field data, which updates over a rolling period and can take weeks to reflect your work. Where available, use Search Console's validation workflow so Google can monitor the affected URLs and confirm the fix.
One successful lab test does not mean every real-user problem is solved. Lab tests use a fixed device and network, while real visitors use older phones, slow connections, logged-in states, and consent banners. Field data is the final judge.
Common Website Performance Issues and How to Fix Them
The right fix depends on your technology stack and the real source of the problem. A WordPress site with a heavy theme needs different work than a custom Next.js application or a Shopify store.
Slow LCP
- Cause: an oversized hero image, a slow server, or render-blocking files.
- Solution: resize and compress images, serve them in modern formats, improve caching and hosting response times, and defer CSS or scripts that are not needed immediately.
Poor INP
- Cause: too much JavaScript running on the main thread, or slow event handlers on menus, buttons, and forms.
- Solution: remove unused code, split large bundles, break up long tasks, and simplify what happens when a visitor clicks or taps.
High CLS
- Cause: images without dimensions, late-loading banners or embeds, and font swapping.
- Solution: set image and video dimensions, reserve space for anything injected later, and review how fonts load and fall back.
Slow mobile performance
- Cause: large page payloads, desktop-oriented scripts, and third-party integrations competing for a weaker processor.
- Solution: review the total page weight on mobile, remove scripts that add little value, and load non-critical integrations later.
Inconsistent performance results
- Cause: real visitors use different devices, networks, and locations than the lab test assumes.
- Solution: compare both data sets for the same URL, check device and country mix, and investigate which interactions or templates produce the slow experiences.
How Core Web Vitals Affect Technical SEO and Lead Generation
Core Web Vitals are part of Google's wider page experience considerations. They matter, but they are not a magic ranking lever. Relevance and content quality carry far more weight, so treat performance as one important piece of technical SEO, not the whole of it.
The business case is simpler. A page that loads slowly, reacts late, or moves around creates friction, and friction can interrupt a visitor who was ready to enquire. Stable layouts and responsive forms matter most on service and landing pages, where one action is the goal.
To see the effect, track performance next to business outcomes:
- Form submissions and qualified enquiries, ideally matched to your CRM.
- Phone clicks on mobile.
- Conversion rate by page or template.
- Search Console clicks and impressions for the same pages.
A hypothetical example: a local accounting firm has a service page that attracts steady organic traffic. Search Console shows the page's URL group failing on mobile. An audit finds two causes: a 2.8 MB hero image delaying LCP, and a form script that blocks the main thread so the Submit button reacts slowly. After the image is compressed and the script is deferred, the firm compares the four weeks before and after the changes. It checks field data for the page, mobile form submissions, and how many of those enquiries turned into real conversations. No result is guaranteed, but the firm has evidence rather than a hunch.
When Should You Hire a Professional Core Web Vitals Audit Service?
In-house troubleshooting handles obvious problems such as oversized images.
Professional help becomes worthwhile when:
- Search Console warnings keep returning after you have fixed them.
- The problems trace back to complex JavaScript, a custom theme, or a framework you do not control.
- Performance stays poor despite plugin, hosting, or image changes.
- A landing page receives traffic but underperforms on enquiries.
Ingenious Hi-Tech can help as a partner for technical SEO, website performance optimisation, and development support. A good engagement focuses on root-cause diagnosis rather than a list of generic tips, prioritised recommendations tied to business pages, hands-on implementation support, and measurement after the changes go live. If you want to see how that fits your site, explore our technical SEO services or talk to us about web development if the fixes require code changes.
Frequently Asked Questions:
What is included in a Core Web Vitals Audit?
A Core Web Vitals Audit combines field data from Search Console and PageSpeed Insights with laboratory testing in Lighthouse. It then diagnoses technical causes, ranks fixes by impact and effort, and finishes with validation, so you can confirm that real visitors, not just test tools, see the improvement.
How often should you audit Core Web Vitals?
Review the Search Console report monthly, and run a full audit at least twice a year. Repeat it after a redesign, migration, hosting change, or new third-party script, because these can quickly alter performance. Monitoring catches regressions early.
Can Core Web Vitals affect Google rankings?
Yes, but modestly. Core Web Vitals contribute to Google's page experience considerations, yet relevance, content quality, and many other systems carry more weight. A fast page with weak content will not outrank a strong, relevant one, so treat performance as one part of technical SEO.
Which tools are best for checking Core Web Vitals?
Google Search Console shows real-user problems grouped by URL, PageSpeed Insights combines field and lab data for individual pages, and Lighthouse provides detailed laboratory diagnostics. Used together, they show where problems exist, how severe they are, and what is probably causing them.
Can improving Core Web Vitals increase Lead Generation?
It can help by reducing friction, such as slow pages or forms that fail to respond. However, lead generation also depends on audience relevance, offer quality, trust signals, page content, and conversion design. Better performance supports these elements but cannot replace them.
Fix Website Performance Issues With Ingenious Hi-Tech
A perfect speed score is not the goal. The real value of a Core Web Vitals Audit is finding the specific causes that frustrate visitors and fixing them in order of business impact. When pages load quickly, respond promptly, and stay stable, your technical SEO foundation is stronger, and more visitors can reach the enquiry form.
Ingenious Hi-Tech helps businesses diagnose and address technical website performance problems with clear priorities and measurable follow-up.
Is your website slow, difficult to use, or struggling to turn visitors into enquiries? Contact Ingenious Hi-Tech to discuss a technical SEO and website performance review tailored to your business goals.